Thursday, December 1, 2016

Blog Literature 2 - Values and Limits of Correlation with Microbial Indicators

LITERATURE 2 - Values and Limits of Correlation with Microbial Indicators

Source:  Payment, Pierre. Locas, Annie. (2011). Pathogens in Water: Values and Limits of Correlation with Microbial Indicators. National Ground Water Association. Ground Water Volume 49, No. 1. 01 Dec 2016.
http://info.ngwa.org/gwol/pdf/110184396.pdf


This literature review focuses on the use of microbial indicators and its ability to predict the presence of pathogenic organisms that can be found in ground water supplies. This report mainly focuses on ground water supplies, as "in sewage, even with very high levels of microorganisms, no mathematical correlation can predict the type or concentration of any pathogen...In surface waters, advanced statistical methods such as logistic regression have provided some level of predictability of the occurrence of pathogens but not specific counts. In groundwater, the continuous absence of indicators indicates an improbable occurrence of pathogen. In contrast, when these indicators are detected, pathogen occurrence probability increases significantly" (Payment and Locas, 2011). The main parameter being used as a microbial indicator will be fecal coliform, based on what is presently known.

Image result for cryptosporidium

There were several criteria that had to be fulfilled in order to use an indicator for pathogenic occurrence probability, some of which include the inability of the indicator to not multiply in the environment, a display of similar behavior to external or natural reactions with the environment as in the pathogen being analyzed, and its ability to be easily isolated, identified and enumerated (Payment and Locas, 2011). An important practice done by the authors of this report is that they reduced "inter-laboratory differences" by testing at the same lab site. It is important to know this because one must understand that at different labs, equipments are calibrated differently, different lab practices are performed both because of the location and because of the experimenters performing the tests, and data collection as a result will be different. By keeping the testing in a single location, errors were greatly reduced. Samples were taken from the Saint-Lawrence River, as well as from local wells in the area.

Two viruses particularly being analyzed are Giardia and Cryptosporidium, because these viruses are known to be detrimental to human health if they are not eliminated from drinking water during water treatment. Scattergrams were performed, and compared to E. coli in order to determine the validity of the results. It was found that more viruses were found in the fall season, which makes sense because of how easily people normally get sick during the summer-to-winter transition. Figure 1 below shows the scattergram results.

Figure 1: Scattergram Results for Sanitary Water Samples in Saint-Lawrence River Area


Similar testing was then done for the river samples obtained from the Saint-Lawrence River. Surprisingly enough, the river water tested negative for the virus, with 55% containing fecal coliforms and 58% containing C. perfringens (Payment and Locas, 2011). These samples did, however, contain the indicator that was supposed to determine the probability of the water containing a pathogenic organism; therefore, based on this observation, other statistical models had to be used to determine whether the water contained viruses. Table 1 shows the results for the river water samples.

Table 1: Results for Saint-Lawrence River Water Samples


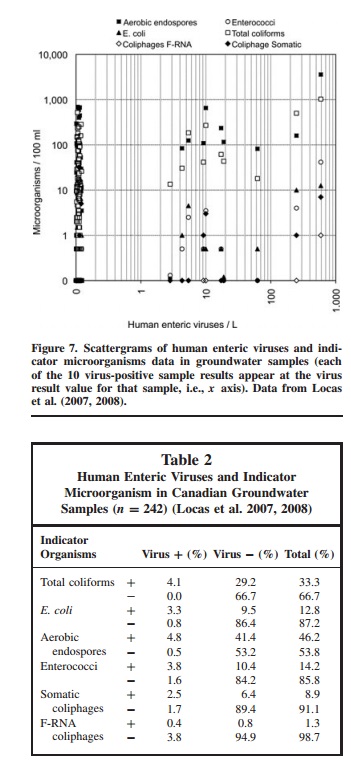
Finally, groundwater samples were tested for the two viruses. Interesting to note from the report is that people were seeing an increase in illness due to viruses coming from apparently clean groundwater sources, which means that the water was not being effectively treated for microorganism removal. Since these water normal do not contain fecal coliform, other indicators were necessary to be found. Figure 2 and Table 2 below show the results from the testing of the groundwater.


Figure 2: Scattergram Results for Ground Water Samples in Saint-Lawrence River Area


Based on their research, it was found that fecal indicators are the best predictor but it is still perfect tool for water quality and human health analysis. It is extremely difficult to pinpoint a single indicator that can directly identify what kind of pathogenic organisms are in the water, or if the water is even consumable. Other indicators will have to be used in combination with fecal coliform in order to properly determine how safe the water really is for consumption.

Thursday, October 20, 2016

Blog Literature 1 - Feasibility of Biodiesel Production in Georgia

LITERATURE 1 - Feasibility of Biodiesel Production in Georgia

Source:  Shumaker, G., McKissick, J., Ferland, C., and Doherty, B. (2003). A Study on the Feasibility of Biodiesel Production in Georgia. University of Georgia, Athens, 3-20.20 Oct 2016.
<http://www.biofuels.coop/archive/GA_biodieselrpt.pdf>


This study was performed at the University of Georgia to determine whether it is possible to reduce the air pollution in the state though the production of fuels derived from plants and foods such as soybeans, cottonseed and peanuts. This is due to the increased problems related to the air quality in many cities across Georgia, as well as a lower pricing for many crops. This proposed solution would allow for mass quantities of crops to be bought for biodiesel production (which would lead to an increase in crop pricing), and would allow the air quality to improve since the combustion products produced during the burning of biodiesel are cleaner than those from petroleum-based diesel.

Focusing on the air quality aspect of the biodiesel benefits, an environmental engineer may very much wish to see a transition towards. According to Shumaker, "Biodiesel has a lower flash point than petroleum diesel and thus helps prevent damaging fires; biodiesel burns cleaner than petroleum diesel and thus reduces particulate matter thus lowering emission of nitrogen, carbon monoxide and unburned hydrocarbons; the odor of burned biodiesel is considered by many to be less offensive than petroleum diesel; there are only limited to no needed modifications to current engines to use biodiesel; there wold be no need to change the transportation and storage systems to handle biodiesel; biodiesel behaves similarly to petroleum for engine performance and mileage; and biodiesel dissipates engine heat better than petroleum diesel" (Shumaker, 2003). As an environmental engineer who decides to specialize in renewable fuels, ti is very difficult to balance the use of innovative biofuels with the integration of the biofuels into the current infrastructure. Should the biofuel require special infrastructure, that results in an expensive project to test if the biofuel will jump-start the market and determine if the biofuel will be implemented in other cities. Such as change would be very drastic if this required a complete change in infrastructure, so sometimes biofuels are frowned upon, despite their benefits. However, in the case of biodiesel, since there is minimal change in infrastructure and it is a blended fuel, it can reside in the current diesel systems, the use of biodiesel suddenly becomes a very attractive alternative. On the downside, though, an environmental engineer using biodiesel in the way being studied is cutting into the state's food supply. It also becomes an ethical issue of "wasting food" to create fuel, or continue using the current diesel so the food can be used for digestive consumption. Other things to consider about biodiesel are that "biodiesel can be corrosive to rubber materials and liner materials. Biodiesel cannot be stored in concrete lined tanks. In some cases, the fuel intake orifices may need to be reduced in size to create higher cylinder pressures" (Shumaker, 2003).


Annual current diesel demands were measured, which came out to be approximately 4.65 million gallons of diesel per day, equivalent to 1.7 billion gallons of diesel per year. From there, the biodiesel production was considered, taking into account that "for each unit of energy required by the process approximately 3.2 units of energy are gained" (Shumaker, 2003). Sources of vegetable oil in Georgia are responsible for making approximately 10 million gallons of peanut and cottonseed oils a year, while a soybeam farm produces 13 million gallons a year, and an outside source of soybean oil produces an additional 17 million gallons per year (Shumaker, 2003). Fats are easily accessible, due to the large market for poultry. However, because many of the facilities that extract bird fats are also using it for other purposes, only approximately 14 million of gallons per year can be made into biodiesel, out of 144 million gallons of fat that can come from poultry. Another source of possible biodiesel can come from yellow grease, but this option is not as viable, as the facilities that produce yellow grease retreat it and repurpose it. Prices, availability, and quantities of the various available biodiesel sources were determined, and based on these values, production plant sizing, cost sensitivity, and final capital cost were taken into consideration.

It was found that a production plant designed for 15MGD would be most suitable for the state. The construction cost of the plant was approximately $9.6 million, and the entire facility would take up nearly 10 acres. It was found that operating costs would come out to be $23 million, including the acquisition of feedstock. It was found that in order for the state of Georgia to produce biodiesel at a relatively inexpensive price, then feedstock was absolutely crucial to make it possible (Shumaker, 2003). Throughout the process, it was assumed that pure biodiesel was being produced. However, since biodiesel is being used as a blended fuel, it was determined that 2% blends of biodiesel can be sold if the following three criteria are met (Shumaker, 2003):
  1. Feedstock costs are near $0.10/lb and retail diesel prices near $1.15/gallon
  2. Feedstock costs are near $0.15/lb and retail diesel prices near $1.25/gallon
  3. A tax reduction becomes available that can recover the difference between the delivered cost of biodiesel and diesel.


The conclusions follow a very logical and results-based train of thought. Since most of the operation cost is from attaining feedstock, it is almost a requirement for the feestock to be cheap. Using a 2% biodiesel blend would be more than enough to meet the needs of the state for fuel consumption. Since this type of fuel can be directly integrated and implemented into the current infrastructure, it is very much a feasible solution to the issues of low crop pricing and bad air quality, as long as the feedstock prices are $0.10 or less. Should the prices of feedstock, it would be wise to reconsider. On a 20% blend, it is shown that the reduction in CO in the air is 12.6%, particulate matter is 18%, CO2 is 20%, hydrocarbons is 11%, and other air-toxic compounds is between 12 and 20%. Such comprehensive data collection and demonstration of results makes this study valid for execution.

Tuesday, September 13, 2016

Spectrophotometer and Bacteria Growth

LAB 4 - Spectrophotometer and Bacteria Growth


Introduction


When cells are exposed to certain environmental conditions, they divide and reproduce at an accelerated rate. Understanding how quickly these bacteria divide in a laboratory allows for microbiologists and engineers to determine how quickly these same bacteria can reproduce in the field. This growth pattern can be appreciated via a growth curve. Growth curves are constructed by taking cultured bacteria, inoculating it, and then measuring its growth at regular time intervals. This time interval is normally an hour, and it done for the length of 24 hours to get the most accurate depiction of bacterial growth.

The purpose of this laboratory procedure is to use a spectrophotometer to determine the growth of bacteria, as well as understand how to use a hemocytometer  to count the number of bacterial colonies in an plate. This allows for a basic estimation for how many cells are present in an inoculating broth with bacteria present. Using the information from both the spectrophotometer and the hemocytometer, the bacterial growth curve can be made.


Materials and Methods

This lab was divided into two section, with Part 1 focusing on the proper measuring of absorbance of samples taken during different time periods. Part 2 was geared more towards using and being comfortable using the hemocytometer and counting bacterial colonies using the hemocytometer.


  • Part 1 was conducted with 10 LB broth samples, ranging from having bacteria for 0 hours to 18 hours. A 1000 µL micropipettor was used to extract 1mL of broth with bacteria  and placing them in spectrophotometer cubettes. The cubettes were then placed into the spectrophotometer, and the absorbance of each sample was recorded. For samples whose absorbance was observed to be beyond a value of 1, PBS solution was used to dilute the LB broth sample and a dilution factor was used to scale up the new value measured in the spectrophotometer. This would allow the readings to be much more accurate.
  • Part 2 was performed with a hemocytometer. A plate was loaded into the hemocytometer using each of the samples used in the spectrophotometer test. The number of cells or colonies were counted using the hemocytometer, and a specific counting procedure. Rules as to what to count and what not to count were decided to beginning the bacterial count. The number of cells was finally recorded.


Results and Discussion

Measuring absorbance for all of the samples proved to be time-consuming, so in order to save time, the groups of experimenters were asked to record absorbance values for three or four samples, which were assigned to them. The procedure to obtain the values was simple enough, as everyone involved in the procedure has a general knowledge on how to operate a spectrophotometer. Figure 1 below shows the proper volume of bacterial broth in a cubette, ready to be tested for absorbance.


Figure 1: Spectrophotometer Cubette with Bacterial Broth

The  issue that caused the most problems during Part 1 of the lab procedure was the values being obtained when diluting the samples with absorbance values greater than one. A dilution factor of 1:1 was being used in this case, which meant that half of the solution in the cubette was the bacteria and LB broth, while the other half was PBS buffer solution. DI water was not used to prevent the hypertonic bacteria from swelling and exploding. Table 1 below shows the measured absorbance values for all of the times samples, as well as the average and standard deviation of each sample.

Table 1: Absorbance of Bacterial Samples


Using the given data, a growth curve can be made. Experimenters were asked to point out the beginning and ends of the lag phase, log phase, and stationary phase. Figure 2 below illustrates the data as a growth curve. As can be appreciated, the lag phase lasted approximately an hour, while the log phase and stationary phase lasted 8 and 9 hours, respectively.


Figure 2: Growth curve of Bacteria 

Part 2 of the lab was originally to be done by the experimenters, but due to the lack of time, ended up being performed by the lab instructor. However, experimenters were asked to come up to the hemocytometer and understand how it works. Figuure # below depicts one such experimenter using the hemocytometer to count cells.


Figure #: Experimenter Jabari Lee Using a Hemocytometer

Overall, the laboratory procedure was performed satisfactorily and was a great experience. This lab helped students properly create a growth curve for any kind of bacteria, following the proper steps of inoculation and measuring absorbance. This lab also assisted students in understanding the importance of cell count and how to establish comprehensive guidelines and rules for counting cells in a hemocytometer.

Tuesday, September 6, 2016

Streak Plate, Culture Transfer Instruments and Techniques, Isolation and Maintenance of Pure Culture

LAB 3 - Streak Plate, Culture Transfer Instruments and Techniques, Isolation and Maintenance of Pure Culture


Introduction

Culturing bacteria in a controlled setting is extremely important in understanding the processes taking places on a microscopic level. Observing and analyzing the behavior of bacteria during culturing allows doctors to fight against deadly illnesses, microbiologists to understand microorganism growth and reproduction, and engineers to properly evaluate and improve water quality. In order to test on a certain bacteria, a single bacteria colony must be cultured from a large population, and the only way to extract a single colony out of the millions and millions of bacteria available is through the use of a streak plate. Microorganism growth can then be measured by isolating and incubating that bacteria colony, while it is inoculated into a broth.

The purpose of this laboratory procedure is to become comfortable and proficient in applying a bacteria onto a streak plate, extracting a colony, and inoculating the bacteria in an LB broth. Due to the nature of this lab being more operational than observational, results will not be heavily discussed. However, execution of provided instructions and perceived comfort or proficiency of execution will be discussed.


Materials and Methods

This lab was divided into three section, with Part 1 discussing how to deposit microorganisms into a streak plate, autoclave operation and how culture medias work, while part 2 was focused on transferring cultures from the agar plate to the inoculating broth, and part 3 focusing on the maintenance of pure cultures once the bacterial colony has been extracted.
  • Part 1 was conducted with an agar plate, a tube of E. coli, and a set of streak toothpicks. Prior to receiving the streak plate, the work surface and experimenter's gloved needed to be sterilized using ethanol. Upon sterilization, streak plate was sent on the clean work surface and the streak toothpicks were opened, making sure one end remained sterile at all times. The sterile end of the toothpick was then dipped into the E. coli sample and was then streaked onto the plate, making sure the agar didn't tear. The toothpicks were then disposed of in a bio-hazard waste basket, while the agar plate was then placed into an incubation chamber.
  • Part 2 was performed with an agar plate with colonized E. coli bacteria, streak toothpicks, and an inoculating broth. Upon incubation of the streak plate, the E. coli microorganisms in the agar multiplied. Colonies were formed during the incubation process. A single colony was then extracted from the agar plate using the sterile end of the streak toothpick. That end of the toothpick was then dipped into the inoculating broth and was stirred to ensure the complete removal of E. coli bacteria from the toothpick. The toothpick was then disposed into a bio-hazard waste basket, while the broth was placed on an incubating stirrer for 24 hours.
  • Part 3 focused on the maintenance of pure colonies after extraction. This part was conducted by the lab instructor. It was explained that frozen pure cultures are maintained to allow for repeated testing. Frozen cultures are known to last several years, which is convenient for a laboratory that regularly performed micro-bacterial experiments. Proper inoculation of pure cultures in a broth allow for growth curves to be formed, and can help determine the growth rate for many organisms.


Results and Discussion

Part 1 of the lab, the proper streaking of bacteria onto the agar plate, proved to be more difficult from a first-person perspective than was anticipated. Figure 1 below provides a visual representation of the proper way to streak a bacteria sample onto the plate.


Figure 1: Proper Streaking onto Agar Plate

One of the most important aspects is preventing the agar from tearing, because this allows the bacteria to a previously unexposed surface, the surface of the agar plate is not rich enough in nutrients to allow the bacteria to grow properly, and the experimenter is risking a non-sterile surface being exposed when the agar tears. Figure 2 below shows an experimenter streaking an E. coli strand onto the agar plate, and the result of that experimenter's performance. Tears did happen when streaking the E. coli bacteria onto the agar, due to it being a new experience. As it was done more repeatedly, however, the nerves of not wanting to tear the agar went away, allowing for the bacteria strand to be deposited onto the agar plate without tearing the agar.

Figure 2: Jose Castano streaking E. coli bacteria onto agar plate


Extracting the bacterial colony was much easier, since the idea of the idea behind the extraction is to stab the bacteria onto the toothpick and then transferring the bacteria onto the inoculating broth. This was done successfully, and the broth was set into a stirrer. An autoclave tape was then set onto the top of the broth cap, made of aluminum foil, to make sure the broth underwent a sterile inoculation process. Figure 3 below shows an experimenter inoculating an E. coli colony into the broth, as well as the broth once the E. coli was inserted.

Figure 3: Inoculating broth with presence of E. coli

Because maintenance of pure microorganism cultures is kept strictly under the supervision of lab managers and instructors, this part of the lab was mostly discussed verbally. Interesting things that were explained during this discussion were that one can order cultures directly from the ATCC, or the American Type Culture Collection, or one can solicit a culture from a nearby University of institution of higher learning for a sample. It was also learned that cultures can be preserved for several years when frozen. Growth curves can be made after only eight hours of inoculation, although it is normally done for 24 hours. This is done as a simulation of what normally happens on an everyday basis. Some bacteria grow in a few hours, while others take days to reproduce. Growth curves help microbiologists, engineers, and doctors see how quickly a bacteria or possible pathogen grows as a population or colony.

Overall, the laboratory procedure was performed satisfactorily and was a great experience. This lab did help very much in helping students hone their skills in streaking an agar plate with bacteria, as well as inoculating a colony of bacteria and maintaining pure cultures. Additional pictures were taken and can be appreciated below, for documentation and observational purposes. 

Additional figures:


Saturday, August 27, 2016

Media Preparation and Autoclave, Plate Pouring

LAB 2 - MEDIA PREPARATION AND AUTOCLAVE, PLATE POURING


Introduction

Culture media are crucial in the controlled growth of bacteria in a laboratory. Two important requirements is that the culture media can nourish the bacteria and that it is fairly simple to make. These medias can be in the form of a liquid broth, or as a gelatinous agar. The use of each form of media will depend on whether you wish to inoculate the colony or want to visualize the bacterial colonies in a petri dish.


LB media is the most common culture media and ideal for pure conditions, made with ingredients such as tryptone, yeast, sodium chloride, and DI water. Due to the fact that LB is so rich in nutrients for bacteria, in order to prevent unwanted bacteria for eating all the nutrients, it is strongly recommended that the media is made just before autoclaving. R2A is another media that is also used for culturing bacteria, but allows the bacteria to grow slowly. R2A is the perfect media for mixed conditions, where there are slow- and fast-growing bacteria and both groups must be analyzed.

The purpose of this lab is to understand the importance of the culture media, understand and be able to operate an autoclave, and to properly and efficiently pour media into the petri dishes. Because this laboratory procedure is more oriented towards execution than analysis, there will a greater discussion on operation than on results. it is expected that some plates will not poured properly, and that some plates will be contaminated due to the amount of time they were open.


Materials and Methods

This lab was divided into tw section, with Part 1 discussing media preparation, autoclave operation and how culture medias work, while part 2 was focused on pouring premade culture media into petri dishes.
  • Part 1 was conducted verbally. The media to be used was premade. Media cultures LB and R2A were discussed, specifically the difference in nutrients that they each possess, as well as bacterial growth rate in each media. An analytical balance was used to measure 20g of LB broth, after which it was poured into a 2L flask along with 1 L of DI water. The water and brother were then mixed and the solution was distributed equally among 10 250mL beakers. Autoclave tape was then place on each beaker to indicate whether the mix was sterilized after autoclave operation or not. Autoclaving was also discussed, in terms of how it operates and how sterilization in an autoclave takes place. An autoclave was set to run for 20 minutes at 120° C. This operation can be already programmed onto the autoclave under a "LIQUIDS" setting. Water was added to the autoclave basin to create positive pressure in the chamber. Upon completion of cycle, the media was store at room temperature, while remaining closed off from the outside environment to prevent contamination.
  • Part 2 was conducted using 25 petri dishes and approximately 500mL of either LB or R2A. The culture media was poured into each dish as quickly and as effectively as possible. to provide a rough estimate, it was requested that 80% of the petri dish surface was to be covered by media and the dish be swirled around to make up for the remaining 20% of available surface area and create a thin film of culture media across the entire surface of the petri dish. A demonstration can be seen below:


Results and Discussion

To understand the importance of controlled bacterial growth in a laboratory setting, it is important to understand the vital role the culture media plays throughout the process. Important notes to be made are:
  • LB media allows for the rapid growth of microorganisms. This is due to the fact that it is extremely rich in nutrients meant to be metabolized by fast-growing bacteria. R2A is tailored to feed slower-growing microorganisms, as it uses more components and nutrients for metabolism than LB.
  • LB media is made exclusively of yeast, salt, and tryptone; R2A implements the use of yeast, peptone, dextrose, magnesium sulfate, starch, sodium pyruvate, and other components.
  • LB works really well for "pure" cultures, meaning that it is perfect for one one group of bacteria to be analyzed. R2A is better for mixed samples of bacteria, such as samples taken from the field.
  • Culture medias can be contaminated easily if left open for too long.

When it comes to the autoclave, one of the most important details is that although it is said that it is run for 20 minutes at 120­° C, it is not totally true. What really occurs is that for the sterilization to occur, the autoclave has to build temperature and pressure up until it reaches the desired temperature (120° C), and then the 20 minute timer starts. Once the timer is finished, the autoclave has to be given time to depressurize and return to room temperature. Failing to allow the autoclave to properly build pressure will not allow the culture to be sterilized, and failing to allow the autoclave to lose pressure after the sterilization will cause the positive pressure to expand rapidly, or explode and hurt the experimenter as well as the culture medias. Figure 1 below shows an autoclave with the samples in the pressure chamber.

Figure 1: Autoclave with culture media preparing for sterilization

Pouring culture media into the petri dishes is important because that is where the culture media coagulates and becomes the gelatinous film upon which the microorganisms grow. A thin film of R2A in our case was needed to cover the bottom surface of the petri dish, and it was stressed that only a little was needed to promote bacteria growth. At the same time, it was important to not get any up on the sides or lid of the dish, as it would grow bacteria on those surface as well and skew the results we would get in an actual procedure. Because pouring was so important in microbiological testing, it was important for us to practice proper pouring technique, as can be appreciated in the video above. Figure 2 shows students pouring media into the dishes, which Figure 3 shows what the final petri dish should look like with media already poured into it. Additional pictures can be appreciated below Figure 3 for documentation, observation and recording purposes.


Figure 2: (from left to right) Sebastian Arbelaez,  Alex Brawley, Jose Castano, Shane Masse, and John Price pouring media into petri dishes.


Figure 3: Final petri dish with culture media

Additional figures:


Friday, August 19, 2016

Working with a Pipette

Lab 1 - Working With A Pipette


Introduction

Pipettes are essential tools used to measures specific volumes of solutions accurately and effectively. The user-friendly design of pipettes allows biologists, engineers, and chemists to easily move a solution from one vessel to another, making sure that the volume of solution needed is accurate. Pipettes are meant to be used with disposable tips that are designed for specific pipettes based on the maximum volume of solution that pipette can handle. Tips are changed in order to maintain sterility, although they can be reused if extracting from the same solution. One of the most important aspects of pipettes is making sure they are properly calibrated so that they are indeed picking up the amount of working fluid that they are supposed to.

The objectives of this lab report were to become competent in using a pipette by properly extracting/disposing solutions and to understand the importance of using an accurate pipette by analyzing the errors associated with pipettes. This laboratory procedure was divided into three parts, which allowed for learning to properly use a pipette and measuring volumes of working fluid in the correct manner. It is expected that errors will occur throughout the process, which will lead to inconsistent results and indications of improper use.


Materials and Methods
Lab 1 was performed in three sections in the following manner, with Part 1 focusing on the mechanical use of the pipette and Parts 2 and 3 focusing on the measurement of fluid using the pipette: 
  • Part 1 was conducted using a 100 μl Eppendorf micropipettor. The top knob on the pipette was rotated in order to set the volume of solution needed. A disposable tip was then attached to the end of the pipette in order to extract the solution. The plunger on the top of the pipette was pressed and held at the first stop point, as pushing it any further would contaminate the pipette and any solution to be sued after. The tip of the pipette was then inserted into the red food coloring solution, perpendicular to the surface of the solution to prevent air from forming bubbles inside the tip and reducing the amount of solution retrieved, and the plunger was subsequently released. The solution inside the pipette was then moved into a beaker, where the plunger was pushed to the first stop point to evacuate the fluid from the tip AND then to second stop point to "send a puff of air to purge the system completely of fluid". This was performed multiple times until the process for transporting solution with a pipette was understood and performed correctly.
  • Part 2 was conducted using a 100 μl Eppendorf micropipettor. A saran wrap was used as a final destination for the samples of food coloring that would be retrieved. 20 μl of red,  25 μl of yellow, 10 μl of blue, and 15 μl of green food coloring were placed on top of each other, in order to form a single drop.  The volume of the combined food coloring drops was recorded, as well as the color of the drop itself. The pipette was then reset to retrieve the recorded volume to determine whether the pipette measured the volumes correctly. 
  • Part 3 was performed using a 1000 μl micropipettor. Two test tubes were also used to contain two food coloring mixes. The first mix contained 200 μl and 300 μl of red and blue food colorings, respectively; the second test consisted of  250 μl of green and 200 μl of yellow food coloring. The final color and volume in each tube was recorded.The 1000 μl micropipettor was adjusted to the total volume in each test tube, to make sure the pipette was calibrated to the right volumes. Calibration was verified by determining if the micropipettor was able to extract all of the food coloring in each test tube.


Results and Discussion
Since Parts 2 and 3 depended on whether or not we can properly and effectively use the pipette, it was imperative that we mastered Part 1 of this lab. Many trials were performed in order to perfect the use of the pipette, which involved adjusting the angle of extraction and the use of the first and second stop positions. Figure 1 below shows the results of the three experimenters successfully using the pipette.

Figure 1. (Left to Right) Sebastian Arbelaez, Jose Castano, and Jabari Lee using a micropipettor

Part 2 heavily relied on the accuracy of the pipette to determine the amount of food coloring extracted. It was recorded that 70 μl of food coloring were used, which led to it black-colored appearance, but it was observed that the pipette left more that 25% of the food coloring still on the saran wrap, as can be appreciated in Figure 2, shown below.

Figure 2. Food coloring solution before (left) and after (right) extraction

A source of error observed by all three experimenters was that the level of fluid dropped after the plunger was completely released, indicating that air was getting into the disposable tip from the top. This means that the seal between the pipette and the disposable tip was not airtight, leading to fluid being pushed out of the tip. Other sources of error that may contribute to the inaccuracy of the pipette in retrieving the solution are:

  • the improper use of the pipette (which would include not holding the pipette perpendicular to the surface of the solution and using the plunger incorrectly),
  • an improper pipette calibration,
  • residue of solution left in the pipette tip (leading to extra solution being added to the final drop), 
  • and using the pipette too close to the saran wrap (this would cause the saran wrap to cover the tip, preventing the fluid from being extracted). 

Due to these factors of error, calibration of the pipette and the use thereof are crucial for obtaining accurate measurements during the procedure, and therefore, more accurate results in the end.


Figure 3. Food coloring solution Test Tube 1 (left) and Test Tube 2 (right).

        Part 3 followed the same practice of Part 2, with the biggest differences being the use of a larger pipette and greater volumes to be retrieved. Figure 3 depicts the final solutions in test tubes 1and 2 before the pipette was reset in order to extract shown amount of solution from each test tube. 
        It was observed that this pipette was calibrated much better than the 100 μl pipette used in Part 2; the 1000 μl pipette picked up nearly all of the fluid in both test tubes 1 and 2. It was also observed the colors within test tubes 1 and 2 were dark blue and green, respectively. Because the 1000 μl pipette performed the task of recollecting nearly all of the fluid in both cases, it was determined that the error was minimal, and that the use of the pipette was properly executed.