LITERATURE 2 - Values and Limits of Correlation with Microbial Indicators
Source: Payment, Pierre. Locas, Annie. (2011). Pathogens in Water: Values and Limits of Correlation with Microbial Indicators. National Ground Water Association. Ground Water Volume 49, No. 1. 01 Dec 2016.
http://info.ngwa.org/gwol/pdf/110184396.pdf
Source: Payment, Pierre. Locas, Annie. (2011). Pathogens in Water: Values and Limits of Correlation with Microbial Indicators. National Ground Water Association. Ground Water Volume 49, No. 1. 01 Dec 2016.
http://info.ngwa.org/gwol/pdf/110184396.pdf
There were several criteria that had to be fulfilled in order to use an indicator for pathogenic occurrence probability, some of which include the inability of the indicator to not multiply in the environment, a display of similar behavior to external or natural reactions with the environment as in the pathogen being analyzed, and its ability to be easily isolated, identified and enumerated (Payment and Locas, 2011). An important practice done by the authors of this report is that they reduced "inter-laboratory differences" by testing at the same lab site. It is important to know this because one must understand that at different labs, equipments are calibrated differently, different lab practices are performed both because of the location and because of the experimenters performing the tests, and data collection as a result will be different. By keeping the testing in a single location, errors were greatly reduced. Samples were taken from the Saint-Lawrence River, as well as from local wells in the area.

Figure 1: Scattergram Results for Sanitary Water Samples in Saint-Lawrence River Area
Similar testing was then done for the river samples obtained from the Saint-Lawrence River. Surprisingly enough, the river water tested negative for the virus, with 55% containing fecal coliforms and 58% containing C. perfringens (Payment and Locas, 2011). These samples did, however, contain the indicator that was supposed to determine the probability of the water containing a pathogenic organism; therefore, based on this observation, other statistical models had to be used to determine whether the water contained viruses. Table 1 shows the results for the river water samples.

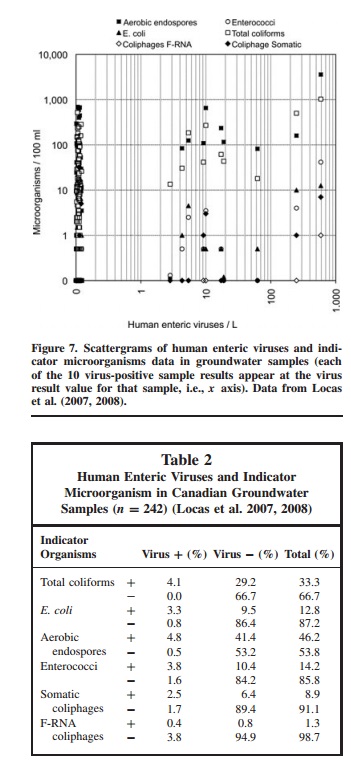
Table 1: Results for Saint-Lawrence River Water Samples
Finally, groundwater samples were tested for the two viruses. Interesting to note from the report is that people were seeing an increase in illness due to viruses coming from apparently clean groundwater sources, which means that the water was not being effectively treated for microorganism removal. Since these water normal do not contain fecal coliform, other indicators were necessary to be found. Figure 2 and Table 2 below show the results from the testing of the groundwater.
Figure 2: Scattergram Results for Ground Water Samples in Saint-Lawrence River Area